

Welcome to the CRYSTALLine home page!#


CRYSTALLine is a program to build, display and manipulate the structures used by the CRYSTAL quantum-chemistry code, to animate the vibrational modes computed from them, and to plot the properties that a calculation returns. It runs on Linux, macOS and Windows, and is built on the CRYSTALClear library.
It follows in the tradition of MOLDRAW, written by Prof. Piero Ugliengo, which served the CRYSTAL community for over twenty years: a program on your own machine, for looking at a structure and changing it, rather than a script to be written each time.
CRYSTALLine is free software under the GNU General Public License v3.
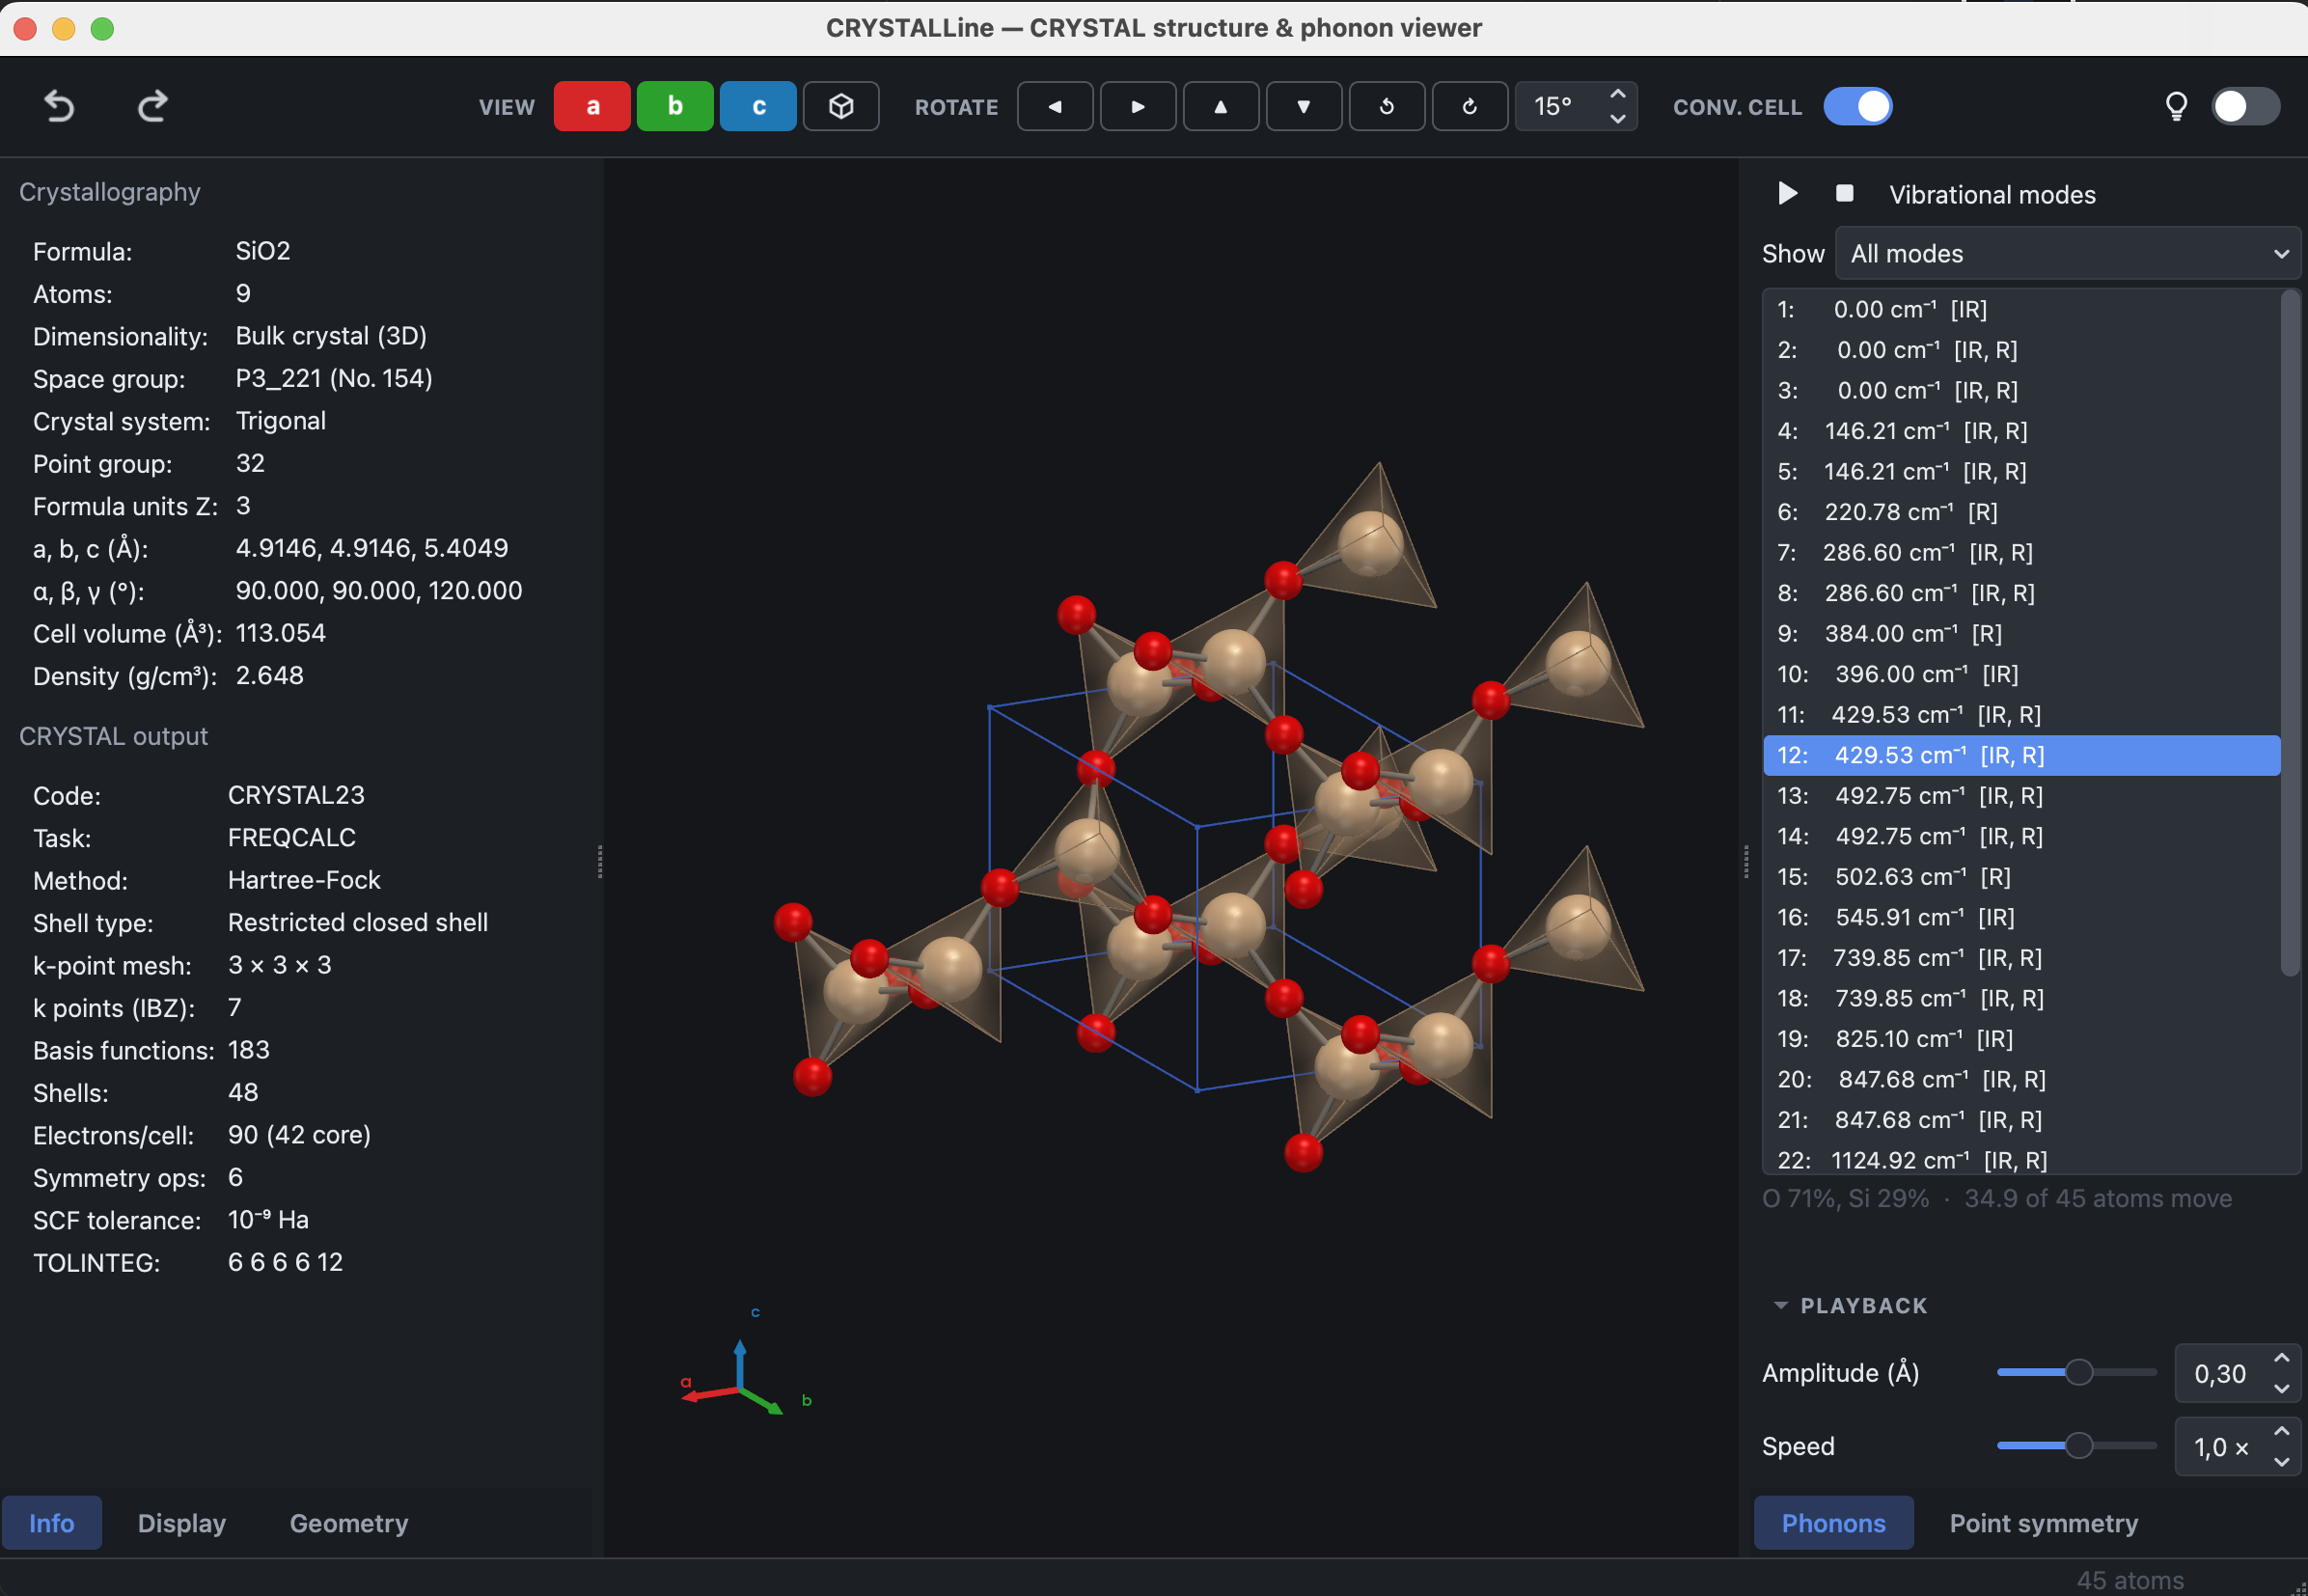
The main window: the crystallography of the loaded structure on the left, the interactive view in the centre, the vibrational modes on the right.
Main features#
Structure display. Atoms, bonds, hydrogen bonds, coordination polyhedra and the unit cell, drawn in an interactive 3D view. Every element of the drawing can be configured from the Display panel.
Crystallography. The space group of a crystal, the layer group of a slab, the rod group of a polymer or the point group of a molecule, with the lattice parameters, cell volume, density and formula. These are recomputed whenever the structure is edited.
Structure manipulation. Atoms can be selected, moved, added, deleted, duplicated and changed in element; cells can be converted between primitive and crystallographic settings, expanded into supercells and edited through their lattice parameters. All operations can be undone.
Vibrational modes. Modes are read from the CRYSTAL output and animated in place. Modes computed away from Γ by a dispersion calculation are animated as travelling waves, and the cell can be tiled over one period. Animations are exported as GIF, as a sequence of frames, or as MP4, MOV and WebM.
Input preparation. Input decks for both CRYSTAL (
.d12) and PROPERTIES (.d3) are written from the structure on screen, with a preview of the file before it is saved. The band path can be defined by clicking the points of the Brillouin zone.Property plots. Electronic band structures and densities of states, IR and Raman spectra (harmonic and anharmonic), elastic properties, equations of state, phonon bands and densities of states, and simulated XRD patterns.
Densities in space. Crystalline orbitals, the charge and spin densities and the electrostatic potential are drawn over the structure itself, as isosurfaces or as slices through the cell, on the grid CRYSTAL computed them on.
Where to start#
Installation describes how to install the program and what to do if it does not start. First steps describes the main window and how to open a file. The remaining pages of the User guide describe each part of the program, and the Reference pages list the menus, the file formats and the known problems.
Acknowledgments#
CRYSTALLine is built on CRYSTALClear, which reads the CRYSTAL output files and draws the property plots, and it uses ASE, pymatgen, spglib and PyVista.
It was developed with the assistance of Claude (Anthropic), using Claude Code.